


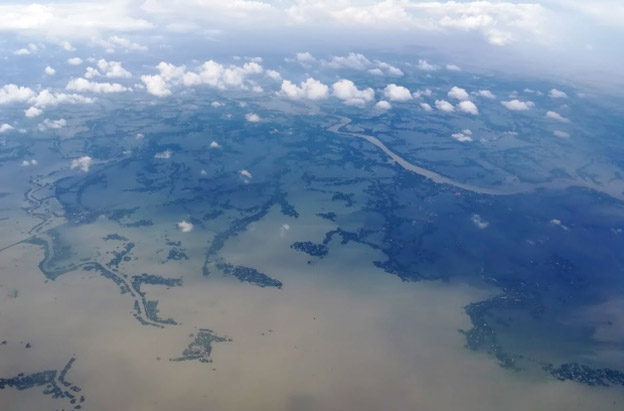
An aerial image of typical flood inundation in Bangladesh. The murky waters reflect flood inundation areas and rural settlements and fields covered by floodwaters. (Photo: Kabir Uddin/ICIMOD)
Cyclone Amphan made landfall in Bangladesh and East India on 20 May 2020. The massive tropical cyclone resulted in the loss of at least 96 lives and caused extensive damage to infrastructure. To make matters worse, communities in the southwest coastal districts of Bangladesh are now facing floods from the subsequent heavy rains and tidal surges while having to adhere to social distancing norms during the ongoing COVID-19 pandemic. The flooding is interrupting the return to normal life for millions of people who were relocated to community shelters (despite fears of an outbreak of COVID-19) after the cyclone struck.
Flood mapping for response
At the moment, humanitarian agencies and the Government of Bangladesh are conducting impact assessments to prepare an effective response strategy. Flood inundation maps are helpful for such assessments. ICIMOD has worked on using synthetic-aperture radar (SAR) satellite remote sensing to provide near real-time inundation maps for supporting flood response, such as during the 2019 Bangladesh floods.
ICIMOD prepared flood inundation maps for Bangladesh by analysing satellite imagery from the Copernicus Sentinel-1 satellite and Sentinel Asia. These maps provide a synoptic overview of the extent of inundation caused by the floods. They can aid disaster management agencies in prioritizing relief and rescue activities in the worst affected areas. To distinguish between perennial waterbodies and the flooding caused by Cyclone Amphan, an image from 16 May was used as the base situation while another from 22 May was used for assessing the flooding situation (see Figures 1 and 2).


Figure 1. Pre/post flooding: Sentinel-1 imageries from 16 May 2020 and 22 May 2020 provide a synoptic overview of the extent of the floods due to the catastrophic Cyclone Amphan. The blue sections indicate flood-inundated areas and perennial water bodies. (Source: Copernicus Open Access Hub/Sentinel-1)
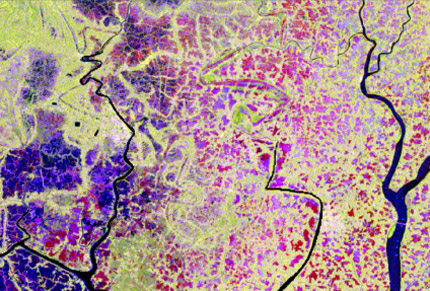
Figure 2. An RGB representation (VH on 16 May as a red band, VH on 22 May as a green band, and VH/VV on 22 May as a blue band) of Sentinel-1 imagery indicates that the red areas are inundated by stormwater, blue areas indicate pre-existing waterbodies (before the cyclone), and yellowish-green areas are other land areas. (Source: Copernicus Open Access Hub/ Sentinel-1)
Inundation situation
Most of the flooding happened in three districts: Satkhira, Khulna, and Bagerhat. Some flooding also happened in parts of Gopalganj and Barisal. District-wise inundation areas are shown in Figure 3 and Table 1
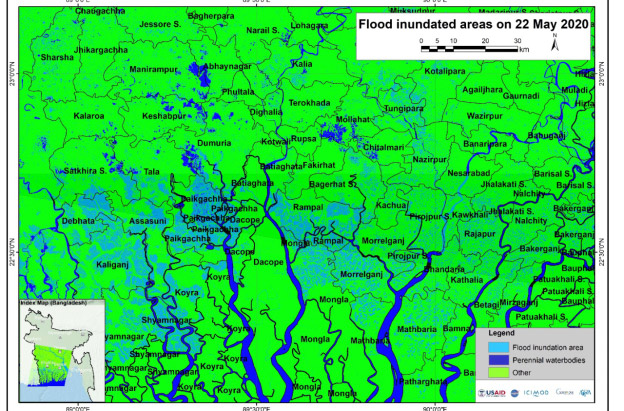
Figure 3. Sentinel-1 based flood inundation map on 22 May 2020 for the Cyclone Amphan affected area. (Source: ICIMOD/Sentinel-1)
| District | Sub-district | Total area (ha) | Flood-inundated area (ha) | Perennial waterbodies (ha) | Other land (ha) |
|---|---|---|---|---|---|
| Bagerhat | Bagerhat S. | 26,863 | 5,129 | 161 | 21,573 |
| Bagerhat | Kachua | 11,580 | 1,727 | 4 | 9,848 |
| Bagerhat | Morrelganj | 42,033 | 13,355 | 119 | 28,482 |
| Bagerhat | Rampal | 31,497 | 15,128 | 270 | 16,087 |
| Barisal | Bakerganj | 35,633 | 7,345 | 407 | 27,882 |
| Barisal | Barisal S. | 24,336 | 2,641 | 852 | 20,842 |
| Bhola | Burhanuddin | 26,652 | 3,464 | 187 | 23,001 |
| Bhola | Tazumuddin | 6,722 | 2,373 | 55 | 4,292 |
| Borgona | Betagi | 16,509 | 2,534 | 118 | 13,845 |
| Gopalgonj | Kotalipara | 36,369 | 4,207 | 275 | 31,887 |
| Gopalgonj | Tungipara | 16,601 | 4,017 | 345 | 12,239 |
| Jessore | Chaugachha | 26,651 | 2,723 | 387 | 23,541 |
| Jessore | Sharsha | 33,261 | 4,088 | 525 | 28,648 |
| Jhalakati | Jhalakati S. | 18,873 | 2,375 | 52 | 16,446 |
| Jhalakati | Kathalia | 14,321 | 2,653 | 18 | 11,633 |
| Jhalakati | Nalchity | 22,266 | 3,864 | 119 | 18,284 |
| Jhalakati | Rajapur | 15,226 | 4,511 | 13 | 10,702 |
| Jhenaidah | Jhenaidaha S. | 46,090 | 4,872 | 150 | 41,067 |
| Khulna | Dumuria | 45,332 | 5,103 | 2,698 | 37,531 |
| Khulna | Paikgachha | 35,129 | 19,199 | 868 | 14,959 |
| Lakshmipur | Ramgati | 35,845 | 3,881 | 4,544 | 23,297 |
| Patuakhali | Bauphal | 43,483 | 6,621 | 383 | 36,437 |
| Patuakhali | Mirzaganj | 14,699 | 2,248 | 51 | 12,390 |
| Pirojpur | Bhandaria | 15,542 | 3,402 | 37 | 12,081 |
| Pirojpur | Kawkhali | 8,961 | 2,681 | 5 | 6,274 |
| Pirojpur | Mathbaria | 33,432 | 6,286 | 110 | 27,036 |
| Pirojpur | Nazirpur | 22,026 | 3,946 | 281 | 17,800 |
| Pirojpur | Pirojpur S. | 25,275 | 6,067 | 203 | 18,988 |
| Shatkhira | Assasuni | 27,395 | 9,736 | 129 | 17,498 |
| Shatkhira | Debhata | 17,197 | 8,709 | 73 | 8,390 |
| Shatkhira | Kaliganj | 44,164 | 17,854 | 198 | 26,113 |
| Shatkhira | Satkhira S. | 37,120 | 6,329 | 1,530 | 29,245 |
| Shatkhira | Shyamnagar | 153,921 | 20,790 | 2,308 | 130,823 |
| Shatkhira | Tala | 33,233 | 4,613 | 1,750 | 26,870 |
*Inundated areas estimated on the basis of the 22 May Sentinel 1 images; can vary on other days (Source: ICIMOD/Sentinel-1)
(This piece was first published on the ICIMOD website on 27 May 2020.)


